

Stability testing after an overclock answers a simple question: Can the CPU reliably produce correct results at the settings I gave it?
When you overclock your CPU, you are running it outside the conditions the manufacturer guarantees. Whether you are raising frequency, changing power limits, reducing voltage, or using Curve optimizer, you can easily take the CPU to a region where the CPU sometimes cannot complete a task correctly. Stability testing is confirmation. We are not necessarily chasing a system crash. However, most people do not know how to perform it, and in this article, I am going to help you. Because you can tune your systems in various ways, stability testing may vary depending on it.
In short, you should never rely on a single stress test. Run a layered routine instead: a short error-checking test to catch obvious failures, a long error-checking test for daily confidence, a per-core test if you have undervolted, a light-load and idle test for low-voltage bugs, and finally your own real workloads. Prime95 Small FFT and OCCT catch heavy all-core instability, y-cruncher and CoreCycler catch single-core and undervolt instability, and Event Viewer tells you what actually broke.
I have already published a CPU overclocking beginner’s guide, plus separate guides for Intel and AMD. So, this article is all about CPU stability testing.
What does instability mean in a computer after a CPU overclock?
Modern CPUs are smart. They know how to shut themselves off or when to reduce the performance to tackle the heat. The operating system may or may not show you what happened on the hardware level. So, stability tests handle the underlying testing on your behalf. System instability is not one thing. It isn’t only a BSOD or a random crash. It can show up in five different ways, and it is important that we get none of it after an overclock.
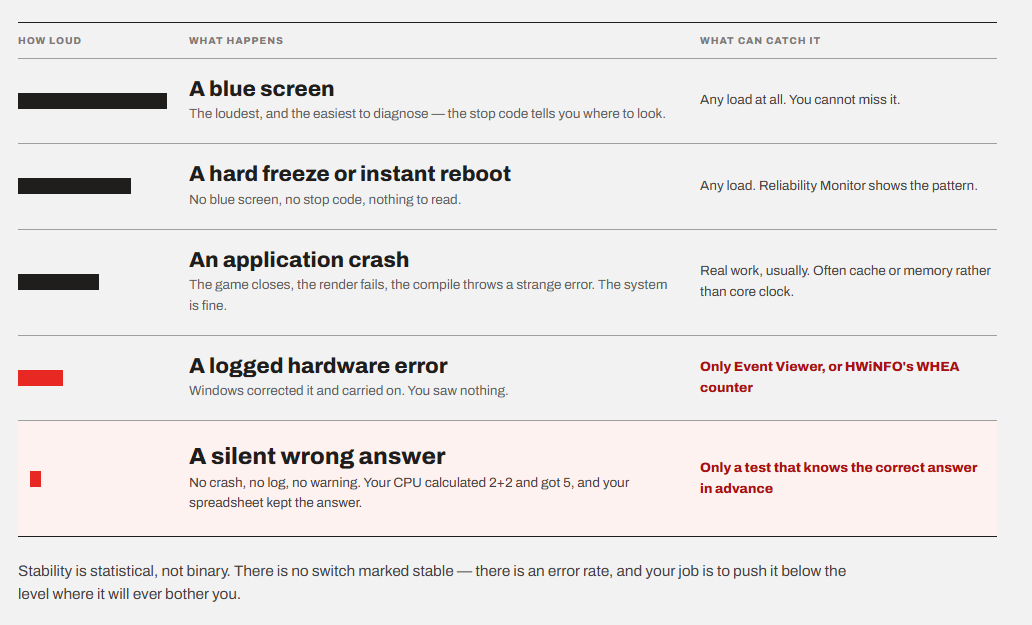
- A blue screen. The loudest and the easiest to diagnose.
- A hard freeze or an instant reboot with no blue screen at all.
- An application crash with no system crash. Your game closes, your render fails, and your compile throws a weird error.
- A logged hardware error that you never see, because Windows corrected it and carried on. This lives in Event Viewer.
- A silent error on the machine level. No crash, no log, no warning. Your CPU just calculated 2+2 and got 5.
All of the above can be detected by the human eye, but the last one is the hardest to find. That last one is the reason stress tests exist. A real stability test calculates something whose correct answer is already known and compares. That is the whole difference between a “load generator” and a “stability test,” and most people use the two words interchangeably.
Most people think stability is binary, but it is rather statistical. Any overclock will have an error rate. At 5.6 GHz your chip might produce one error every 30 seconds. At 5.5 GHz, one error every 40 hours. At 5.4 GHz, one error a year. After an overclock, you are not proving your CPU is perfect. You are pushing its error rate below the level where it never gets in your way.
Undervolting and overclocking failures are different in nature.
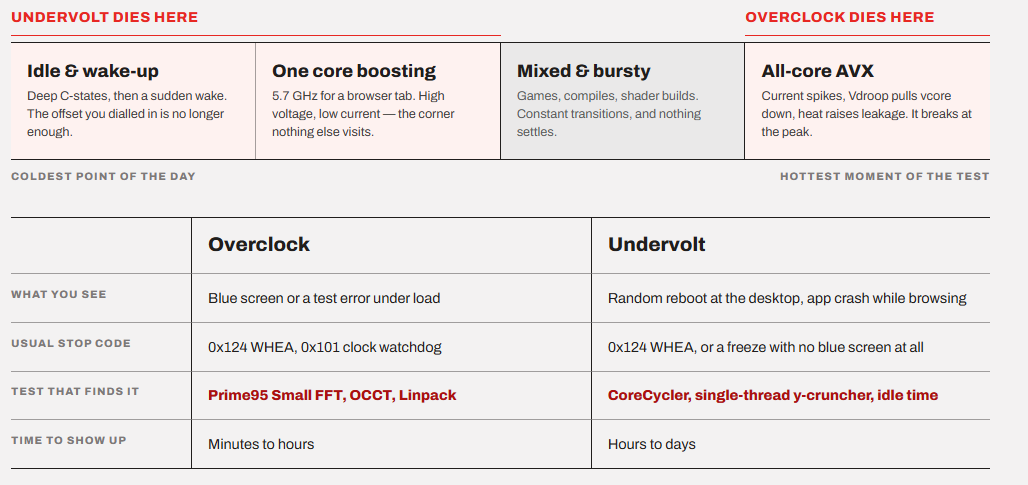
Although undervolting and overclocking both end up in a situation with not enough voltage for the requested frequency, they get there through opposite load conditions.
An overclock fails under maximum all-core load. If you have raised the frequency, you will need more voltage to sustain it. Under a heavy AVX workload, the current draw increases, Vdroop takes the actual core voltage down, the CPU heats up, and leakage makes things worse. The failure happens at the hottest, heaviest moment of the test.
On the other hand, an undervolt fails under light load, single-core boost, and idle. We generally lower the voltage curve when we undervolt, which is not a major issue under all-core load where the CPU is running at a power-limited clock with a relatively generous voltage. However, the moment one core has to reach its boost clock or when the CPU drops into a deep C-state and wakes up again, the offset you have chosen is no longer enough. And this can happen during even the very basic tasks like opening a browser tab.
This is the reason when you undervolt a Ryzen chip with Curve Optimizer and then validate it with 12 hours of Prime95 Small FF, and you are happy that everything is fine. But, the next day, you open Chrome to look at your emails, and your PC reboots.
So, my point is that overclocking fails generally on all-core heavy loads, while undervolting failures happen when the system has a light load or during single-core boost, or just while waking up. The unstable behavior will also be different. Overclocking failures show up as BSOD or test errors under load, while undervolting failures are as simple as random reboot at desktop or app crashing while browsing. So stability testing procedures should be different in both cases. Most importantly, if you have applied both the overclocking and undervolting, the testing procedure will be much wider.
However, do not worry about anything at all. I will show you everything in detail in this article so you are left with no confusions.
Before you start
I am assuming you have already applied your overclock or undervolt and the system reboots. Do these before you start your first test.
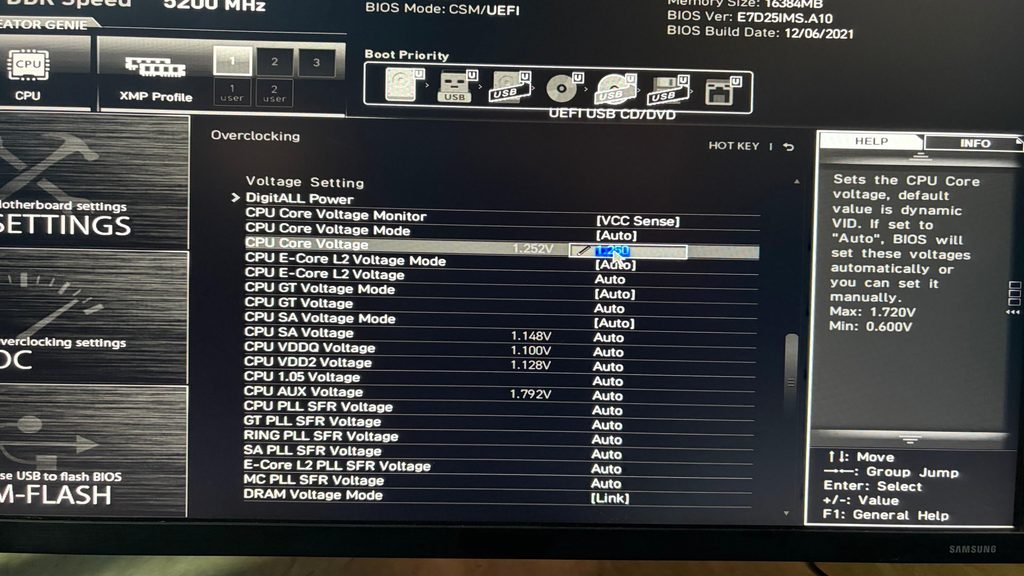
1. Save your BIOS
Most of the motherboards will let you save profiles to a slot or to a USB stick. Save the known-good stock profile and save the new one. When something goes wrong, you will not want to re-enter 30 settings.
2. Know your recovery path
Check where your CMOS clear jumper or button is. If your board has BIOS Flashback, know how to use it. A failed boot is normal during this process, and you should always know how to recover from it.
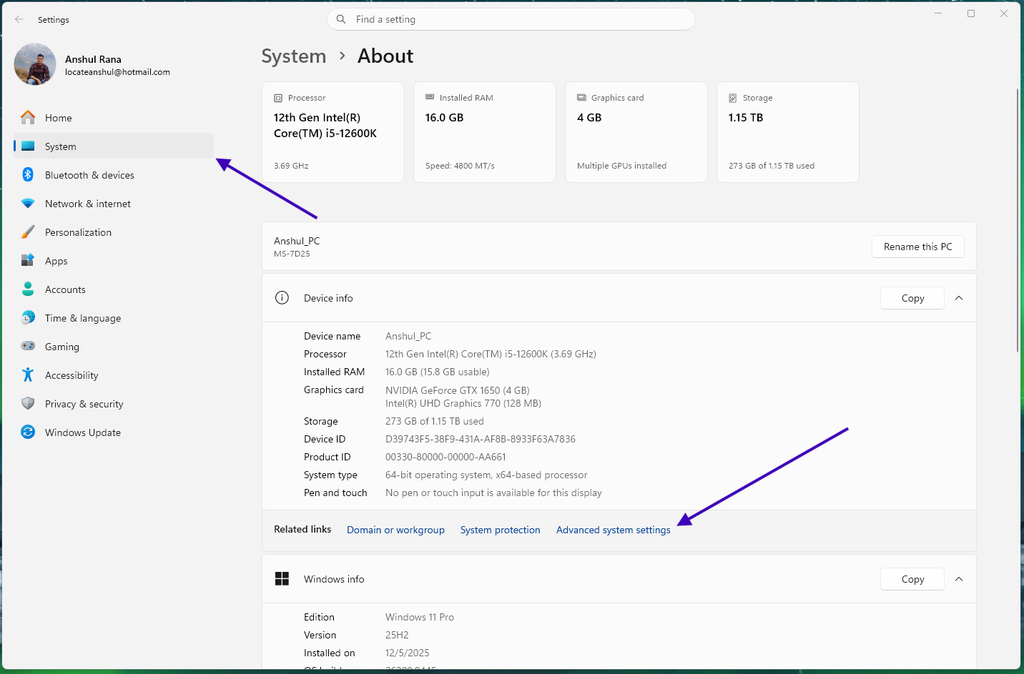
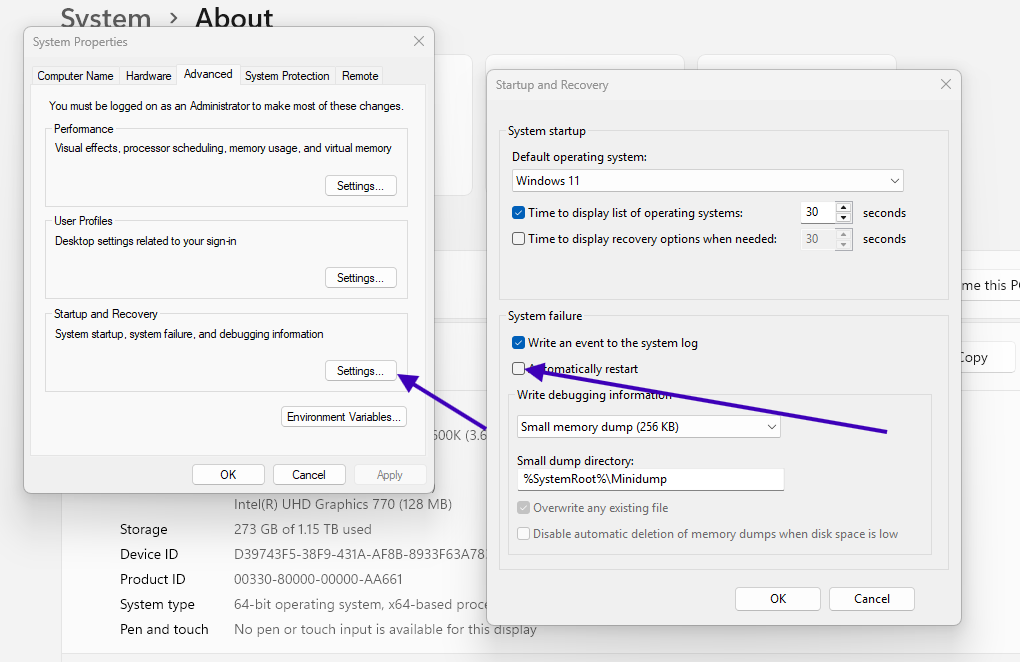
3. Turn off automatic restart on BSOD
If you do not do it, the machine will be right after the BSOD error, and you will have no time to read the stop code. To do this:
Go to Control Panel > System > Advanced system settings > Startup and Recovery > Settings, and uncheck Automatically restart.
4. Set RAM to stock settings
You might hate hearing it because it may lower your benchmarks even lower, but I recommend doing it for a reason. It helps with confirming the errors because some errors like WHEA can be caused by both memory and the CPU. So, if it happens, you will have no idea which one caused it. So, set memory to JEDEC defaults or a known-stable EXPO/XMP profile you have already validated. Tune one thing at a time.
5. Understand the meaning of stability
The level of stability you need depends entirely on what you do with the machine. For a gaming PC, stability might mean a few hours of demanding gaming without crashes, freezes, or application errors. For general desktop use, it could be mixed with everyday use without WHEA errors, corrupted files, or application failures. For content creators, it could be running demanding software for long periods along with successful renders or other things. However, there are some bare minimums that we discussed above, and those are important for all the systems. So, before you proceed, know what you are aiming for.
Monitoring software: what to install before anything else
Before you do any stress testing, make sure you have a suite of monitoring software. They tell you what is happening while the tests are going on. Running blind stress tests is pointless. It is important to monitor at least the basic things like temperature, voltage, power, and effective clocks. Monitoring software helps you with that.
1. HWiNFO64
This is the one I use, and it is the one I would recommend to everybody. It reads more sensors than anything else, it logs to CSV, and OCCT embeds its monitoring engine. It is the most detailed program, so it may take to get a hold on to all the values. But, even if you have only this program, you can easily monitor all your system.
Run it in sensors-only mode. The values that you have to look for are
- Core VID (what the CPU is asking for) and
- CPU Core Voltage / SVI3 TFN Core Voltage (what it is getting)
- Core Clocks and, more importantly, Effective Clocks
- Core Temperatures and CPU Package / Tctl/Tdie
- CPU Package Power, PPT / PL1 / PL2
- Thermal Throttling, Power Limit Exceeded, and on AMD, PROCHOT and Core Performance Limit Reasons
- WHEA error counter, near the bottom
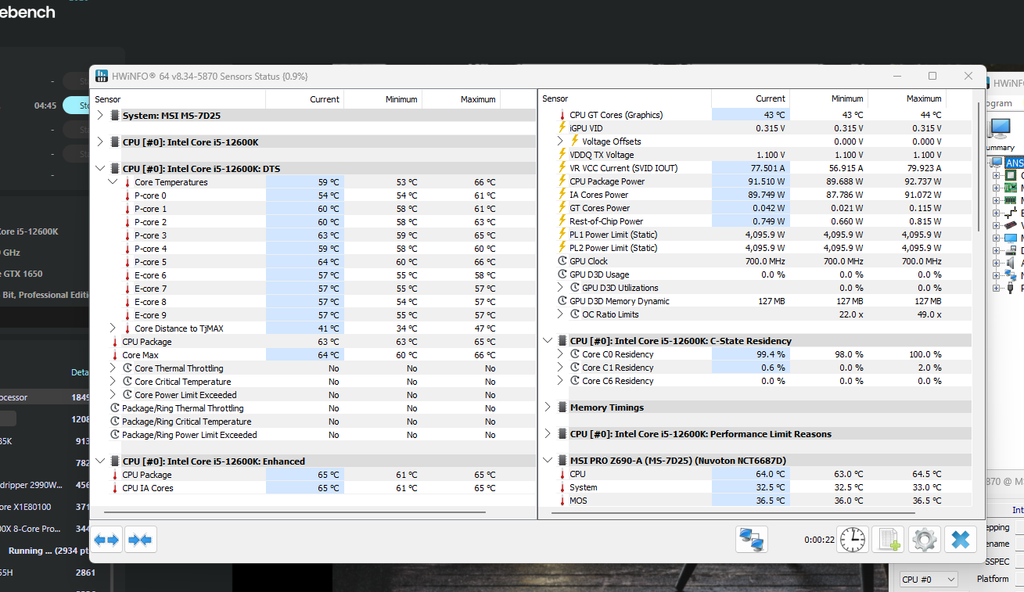
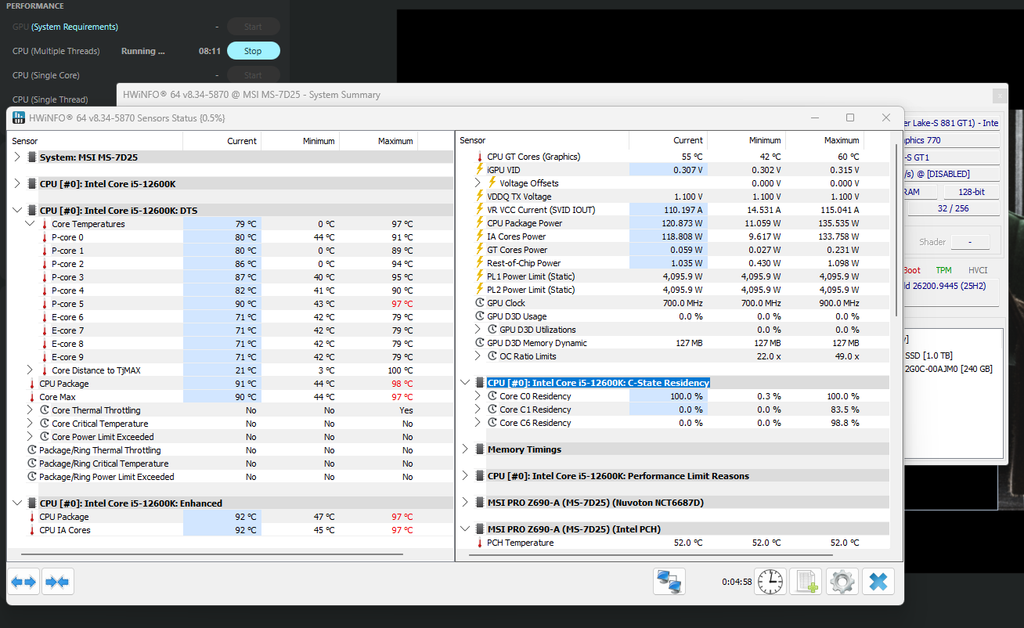
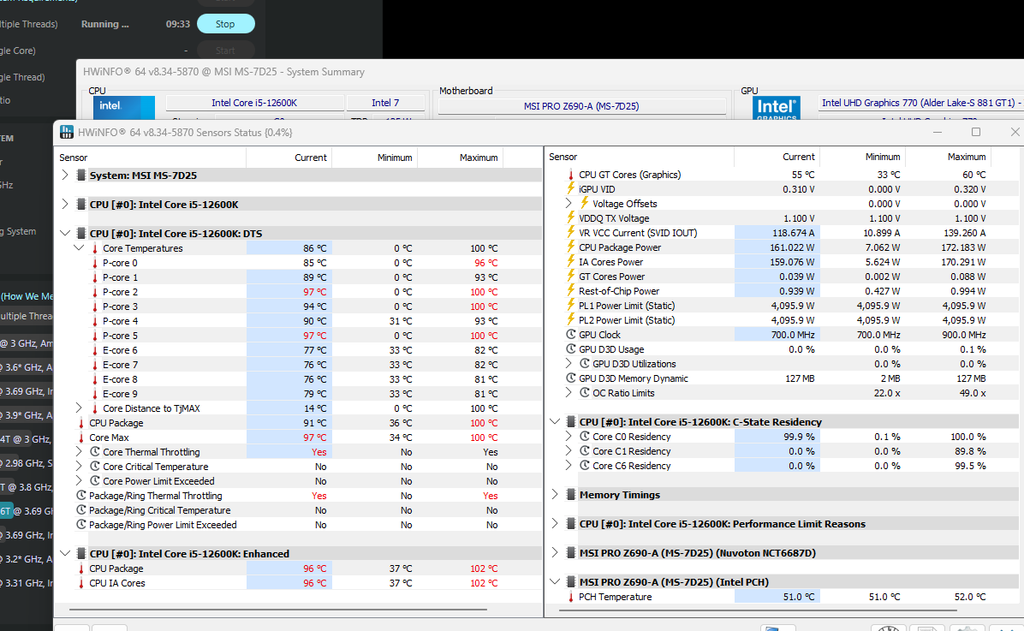
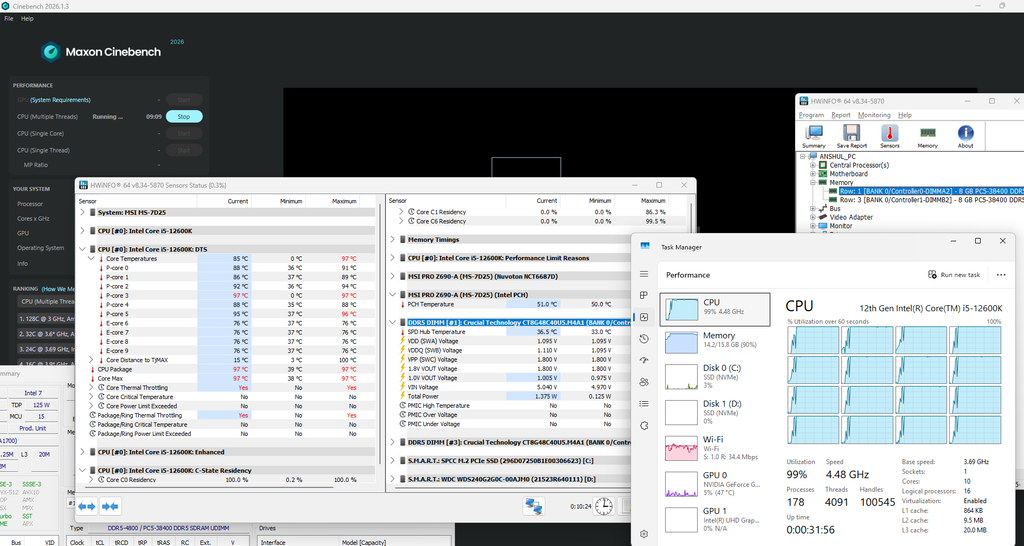
Take your time locating these values and make sure you keep an eye on them when running your tests. We will get back to HWiNFO later in the article.
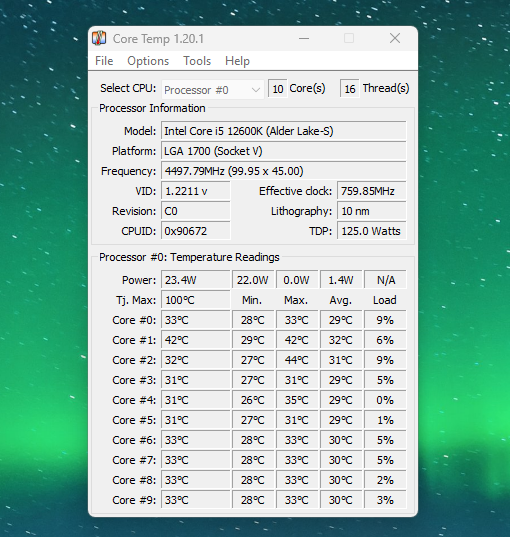
2. Core Temp
Small, light, and shows per-core temperature and VID. Good for screenshots when HWiNFO’s wall of sensors is overkill.
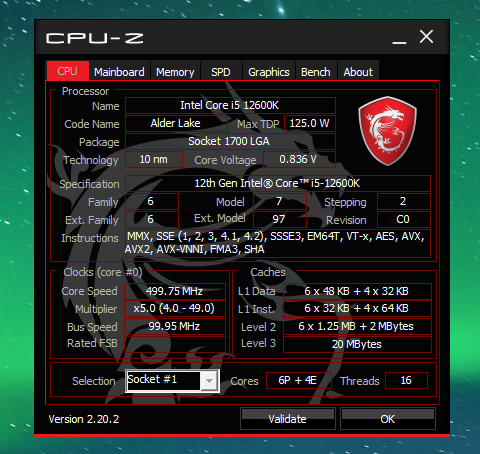
3. CPU-Z
CPU-Z is great for confirming the clock, the multiplier, the voltage, and the memory timings actually applied. The validation link is also handy when you post results on a forum.
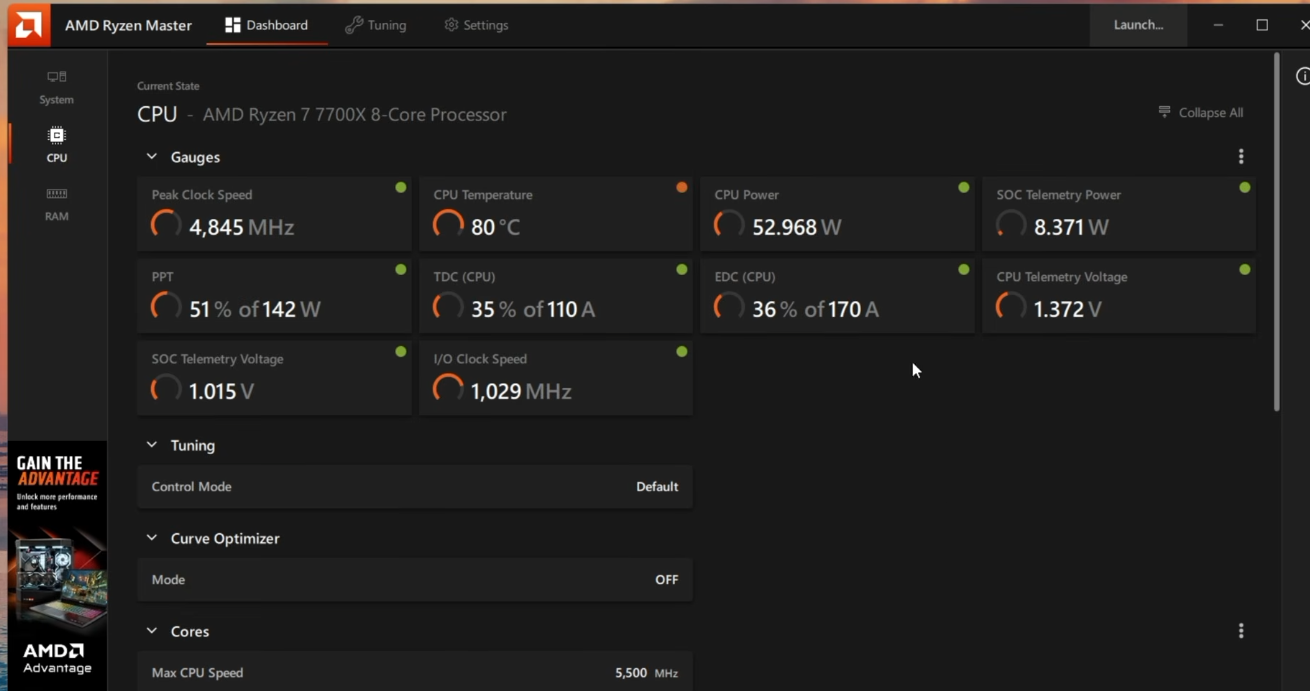
5. Ryzen Master (AMD)
Shows per-core effective clocks, per-core “best core” ranking, and PPT/TDC/EDC limits, and lets you change Curve Optimizer from Windows without a reboot.
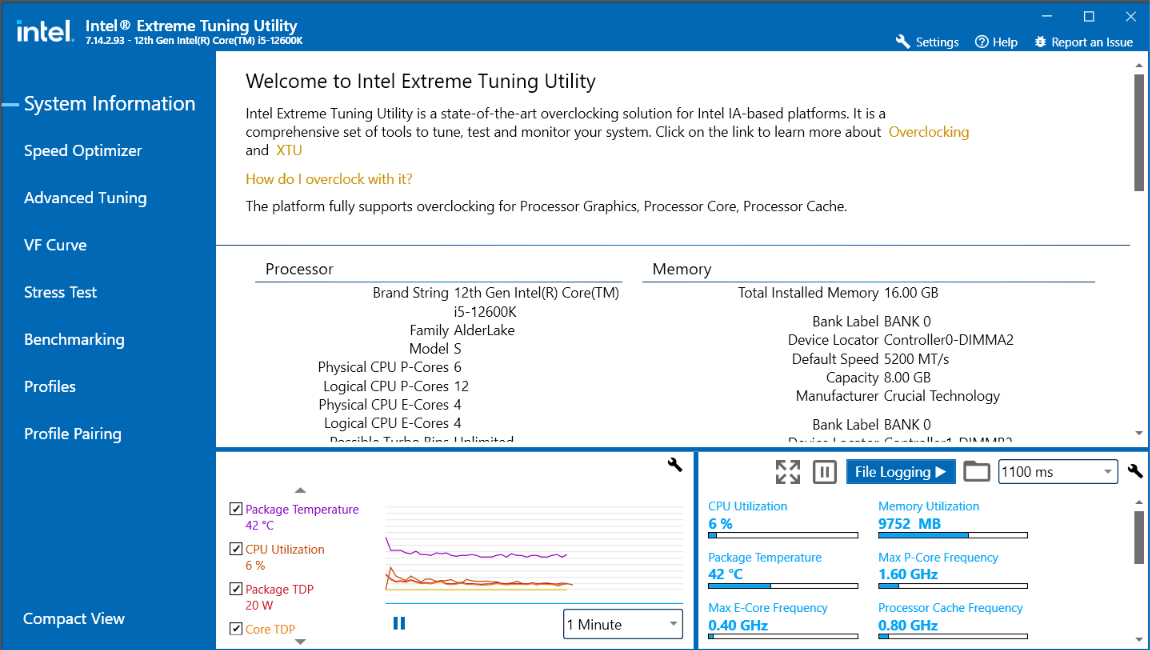
6. Intel XTU (Intel)
Same idea for Intel. Voltage offsets, core ratios, power limits, and a live graph of frequency, temperature, and throttling reasons. You can also run the dedicated stress test if you have an Intel CPU.
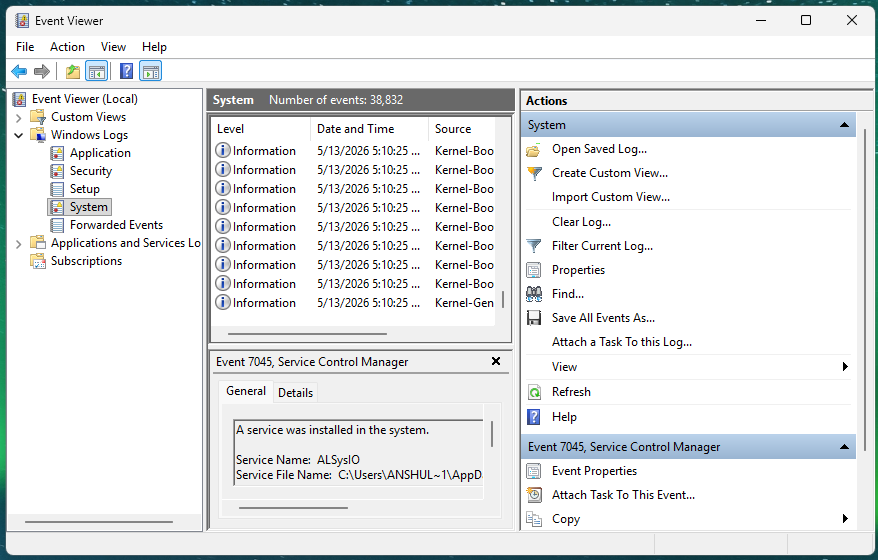
7. Windows Event Viewer
Not glamorous but absolutely essential. I will cover what to look for later in this article.
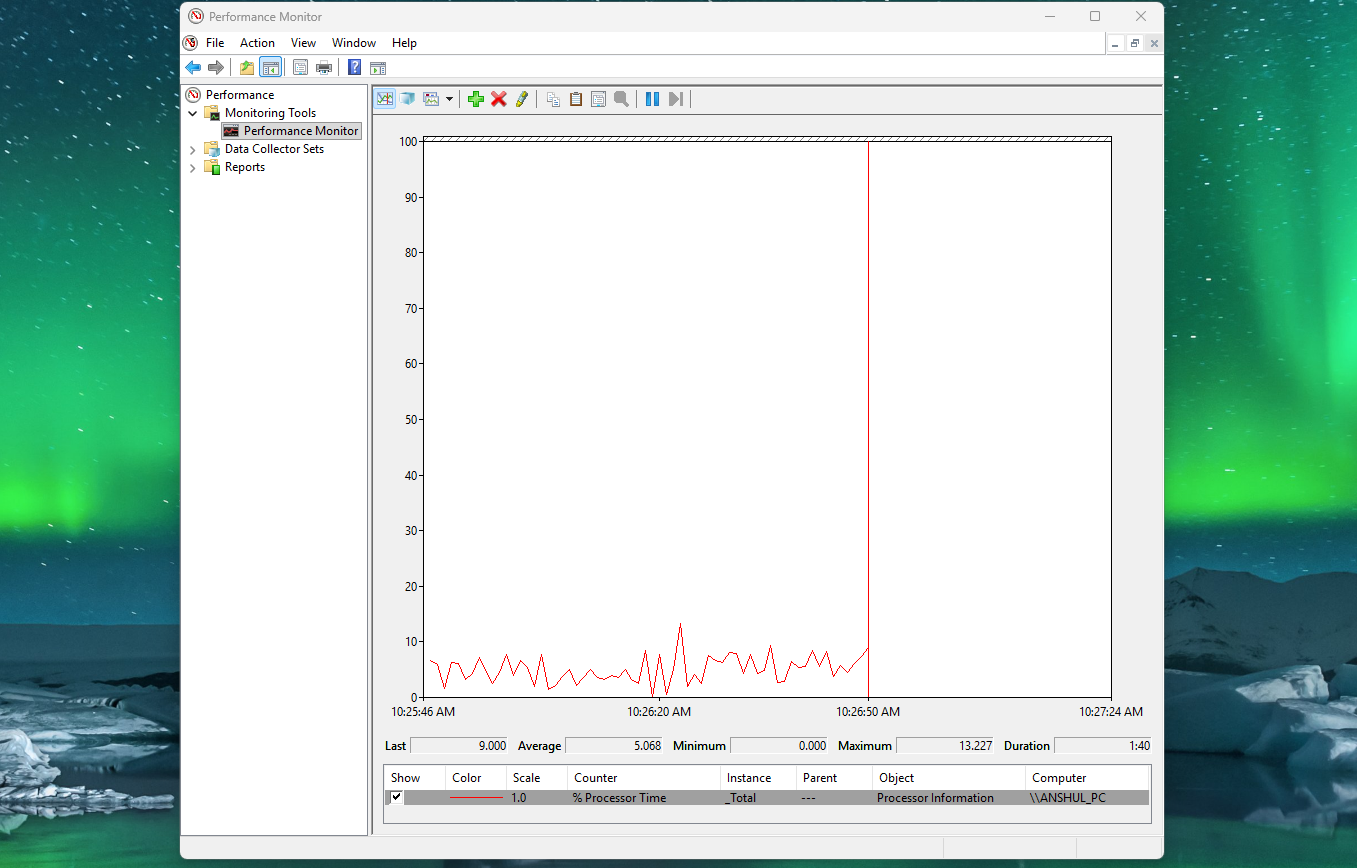
8. Windows Reliability Monitor
Type perfmon /rel into the Start menu. It gives you a calendar view of every crash, freeze, and app failure. It is the fastest way to spot a pattern of frequent failures without any reasons.
Some tips before we proceed
1. Watch effective clocks, not requested clocks
Modern CPUs do not fail cleanly. In case the voltage is marginal, both Intel and AMD can silently stretch the clock speed. So, it is possible that the core reports 5.5 GHz and the sensor also shows 5.5 GHz, but the actual work being done is utilizing something much lower. This is basically the chip protecting itself.
So your test passes, and you might think you have a 5.5 GHz overclock. You don’t. You have a 5.5 GHz label on a 5.3 GHz chip. So, make sure you always look at the effective clock rather than the requested clock. To see the effective clock, make sure you open the Core Effective Clock dropdown in the Sensors data rather than watching the simple core clocks dropdown. Look at the screenshot below
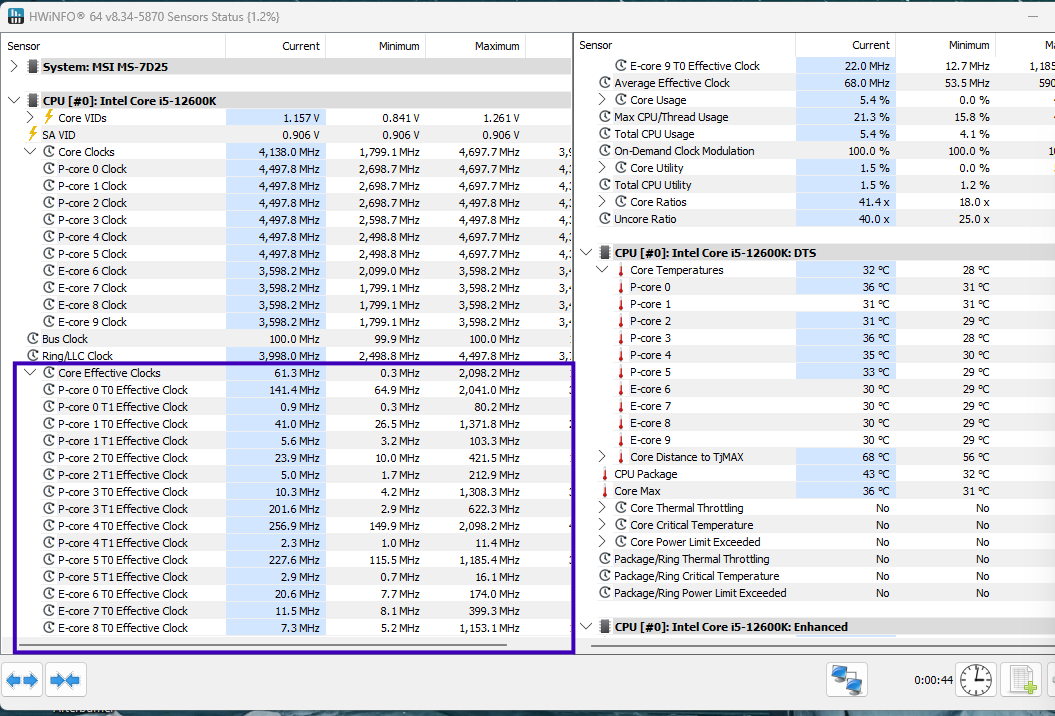
2. Always compare Core Clock against Effective Clock in HWiNFO.
This is most important in a fully loaded test. If the effective clock sits well below the reported clock while utilization is at 100%, you are stretching. Mostly, the fix here is more voltage, not more testing. Same goes for the benchmark scores. If you add 200 MHz and your Cinebench scores don’t move, something is eating your gains. This is again a stability signal and not a benchmark issue.
Which software should you use for CPU stability testing?
Here is a list of every tool worth installing and using for different types of tests. Let’s talk about them one by one.
1. Prime95 (Heavy all-core stability)
Yes, it looks a very basic and classic type of software but is the best when it comes to heavy all-core testing. It searches for Mersenne primes using FFT maths and verifies its own results, so it genuinely catches calculation errors rather than just crashes. Here is how you use it.
You want Options > Torture Test, and then the mode matters a lot:
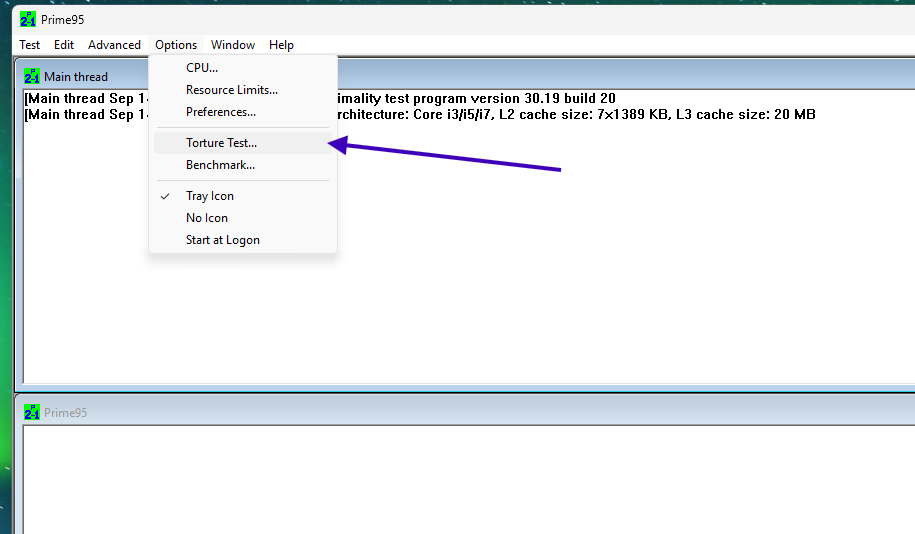
- Smallest FFTs: Fits inside L1/L2. Maximum heat and current on the cores. Minimal memory involvement.
- Small FFTs: Fits in cache. This is the standard CPU-only torture test and the one I use most.
- Large FFTs (in-place): Pulls in the memory controller and RAM. Highest total system power.
- Blend: Mix cores, cache, and RAM together.
- Custom: Set your own FFT range. Useful for targeting cache stability specifically.
You can also toggle the instruction set. In the torture test dialog, you can disable AVX, AVX2, and AVX-512. This matters enormously. You can choose the number of cores to test and where you want to use hyperthreading or not. Hyperthreading makes it much more stressful. The option to disable AVX2 is at the end.
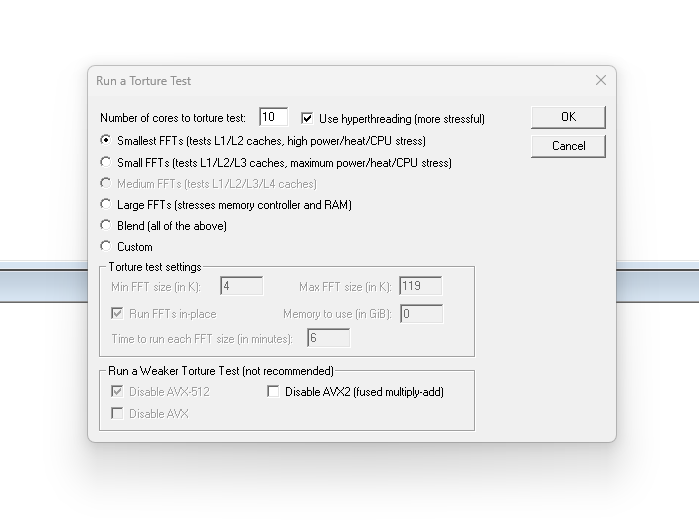
My suggestion: Prime95 Small FFT with AVX2 is the best heavy all-core stability test available, and it is what I would use to validate a straight frequency overclock.
But Prime95 with AVX-512 enabled is sort of a power run for your CPU, not a stability test. It will take a modern chip to power and temperature levels that no real application can ever produce. If you reject an otherwise perfect overclock because it failed Prime95 AVX-512 Smallest FFT, you have just wasted your overclock to chase the performance that no real-world application will ever demand.
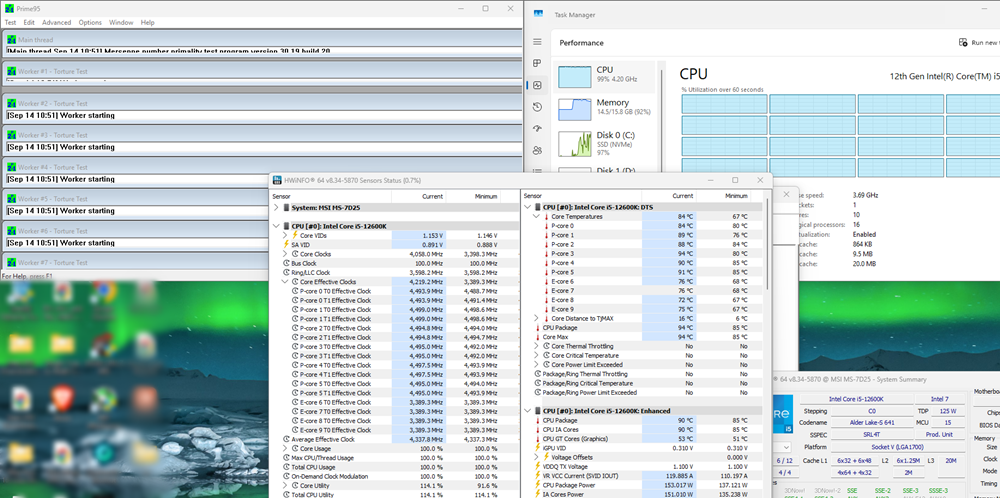
So, my opinion is to use it to test your cooling. Don’t use it as your pass/fail gate for daily use.
Also keep in mind: if a worker stops with an error, the others keep going. Check the window for “FATAL ERROR: Rounding was 0.5, expected less than 0.4.” That is a failure even though nothing crashed.
What to look for?
Open HWiNFO and start tracking CPU Package Power against your PL1/PL2 or PPT limit. Keep track of the core temperature and CPU throttle warnings. Again, keep track of core clocks next to effective clocks. Small FFT is the test where clock stretching hides best, because the load never varies and nothing looks wrong.
Along with these, keep CPU Core Voltage (SVI2/SVI3 TFN) on screen next to Core VID. The gap between the two is your Vdroop. If that gap widens as the test runs and the chip heats up, your load-line setting is the thing to look at, not your multiplier. Do not forget the WHEA errors counter when the test ends, even if you think everything went perfect.
2. OCCT (All-in one stability testings)
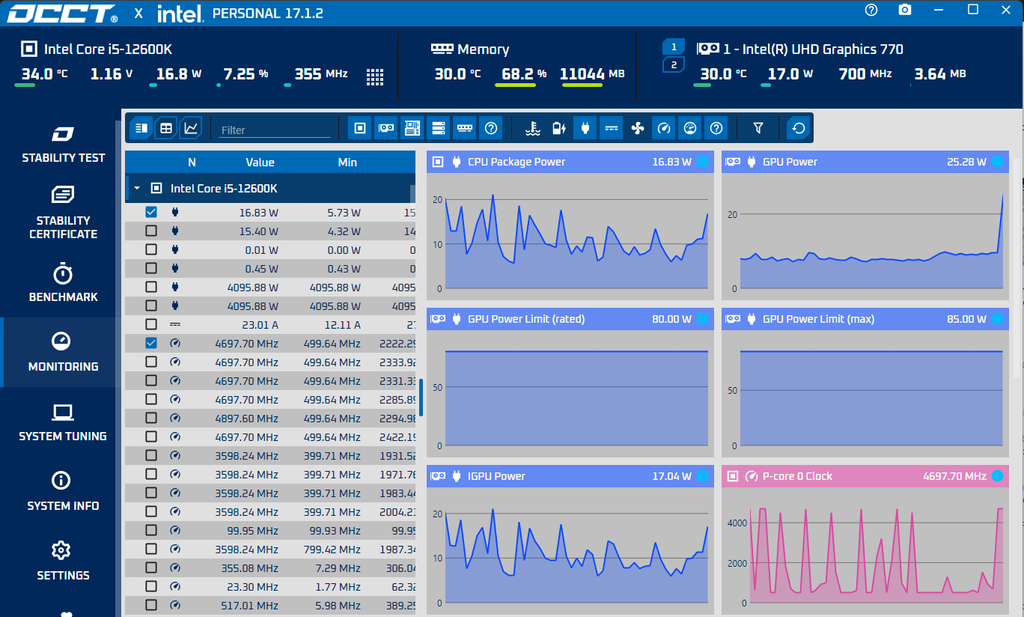
OCCT is one of the best tools if you are a beginner. It is the most complete package to allow you to test CPU, memory, GPU, power supply, and other 3D loads in one application. It has also got error detection built in and HWiNFO’s monitoring engine embedded, so you get temperature and voltage graphs in the same window. It offers several important options like:
- Data set: Small / Medium / Large / Extra Large: small stays in cache, large drags in RAM.
- Mode: Steady / Variable: This is the good part
- Instruction set: SSE / AVX / AVX2 / AVX-512
- Load type: Extreme / Normal
- A separate Linpack test and a memory test
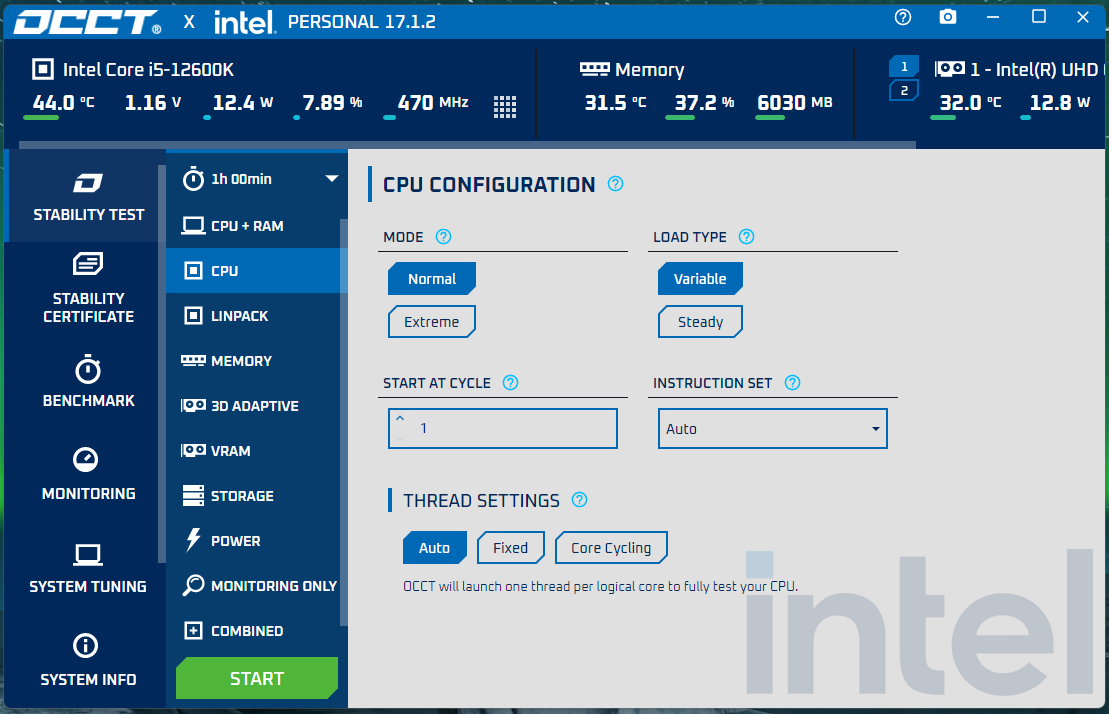
My suggestion on OCCT: I think OCCT’s variable load mode is highly underrated, and it is the reason I keep this program installed on any overclocked system. What I like is instead of holding a constant 100% load, it cycles the load up and down. That means voltage and frequency keep changing, which is exactly the condition that exposes marginal undervolts and load-line problems. If the load is steady, it settles the VRM into a comfortable state. A variable load will never let it settle.
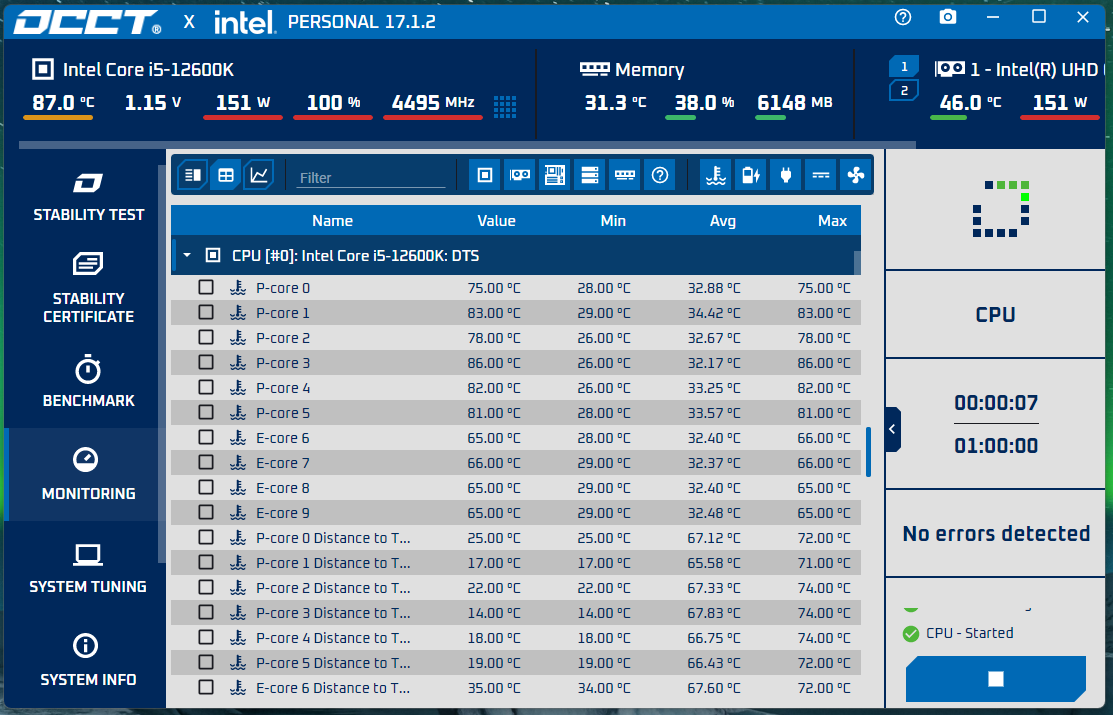
In my opinion, for undervolt validation on an all-core basis, OCCT Variable beats Prime95 Small FFT easily. OCCT also stops automatically when it detects an error and tells you which core failed, which saves you from staring at a log. OCCT is full of other basic and advanced features that you can test on your own. It also gives you a stability certificate once the test is successfully completed. However, it will keep giving you popups to upgrade to the paid plans. But I think you can face that.
What to look for?
Although OCCT shows most of the graphs and sensor data that HWiNFO will show you, I would suggest keeping track of the minimum and Maximum columns of temperature and voltage. This is important in variable mode.
Minimum CPU core voltage is very important to check. This is the lowest voltage when the load drops. That momentary dip is what kills a marginal undervolt, and you will never catch it by staring at a live readout. Also watch the core clocks swinging up and down through the run.
3. y-cruncher (extreme CPU and memory stability)
y-cruncher simply computes Pi to billions of digits, and it has become the sharpest error-detection tool in the overclocking community. It hammers the cache, the memory controller, and the FPU at once, and it verifies everything.
The most impressive part and the one we will use is the component stress tester. For this, press 2 in the main menu or run it with the stress argument.
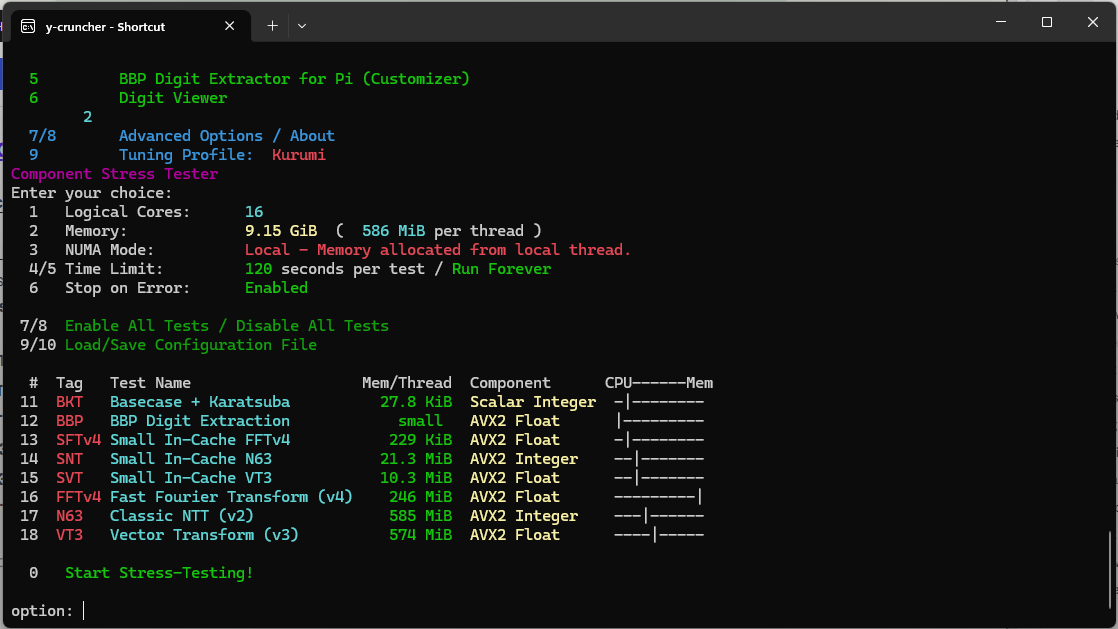
Inside this mode, you will see separate algorithms, and they test different things:
- BKT, BBP: Mostly ALU and light on memory
- SFT / SFTv4: FFT-heavy, hard on cache and the memory subsystem
- FFT / FFTv4: Similar, different code path
- N63 (formerly N32/N64): Historically the algorithm that finds errors nothing else finds
- VT3 (formerly VST/C17): Mixed integer and floating point
- HNT, C17: Older algorithms, removed in recent builds
I have used a Y-cruncher N63 a lot, and I think it is the single most sensitive test I know of for finding marginal instability and errors in systems that passed everything else. If your goal is genuine confidence rather than a screenshot, run y-cruncher.
To run N63, you disable other tests by entering their respective values. Just keep N63 enabled. See the screenshot below.
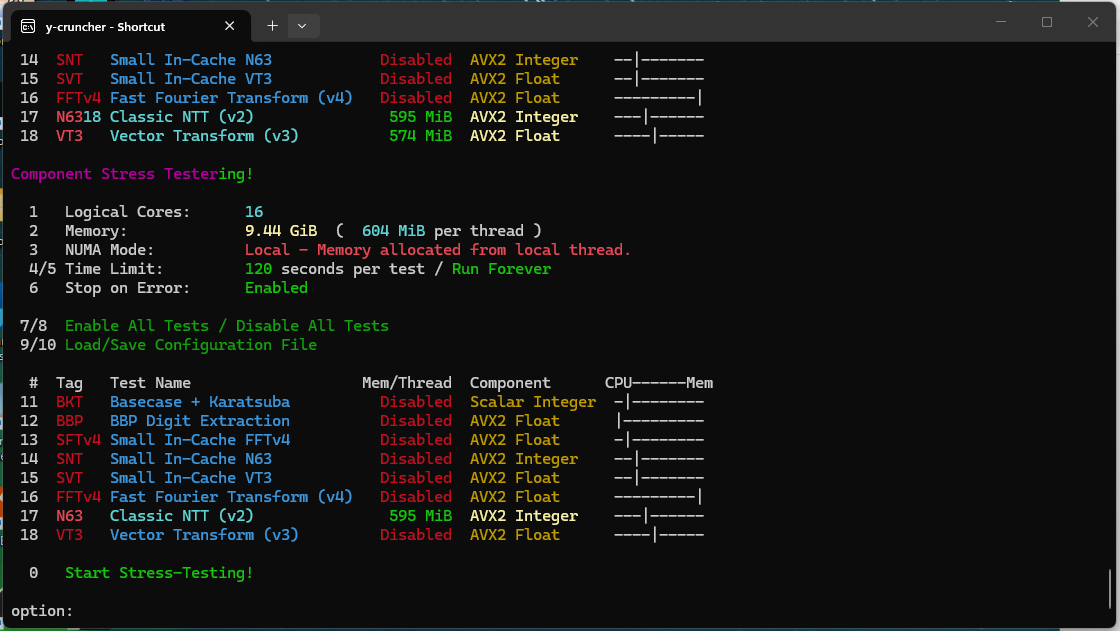
Then, enter 0 and hit enter the start stress testing. Again, keep an eye on HWiNFO sensors data.
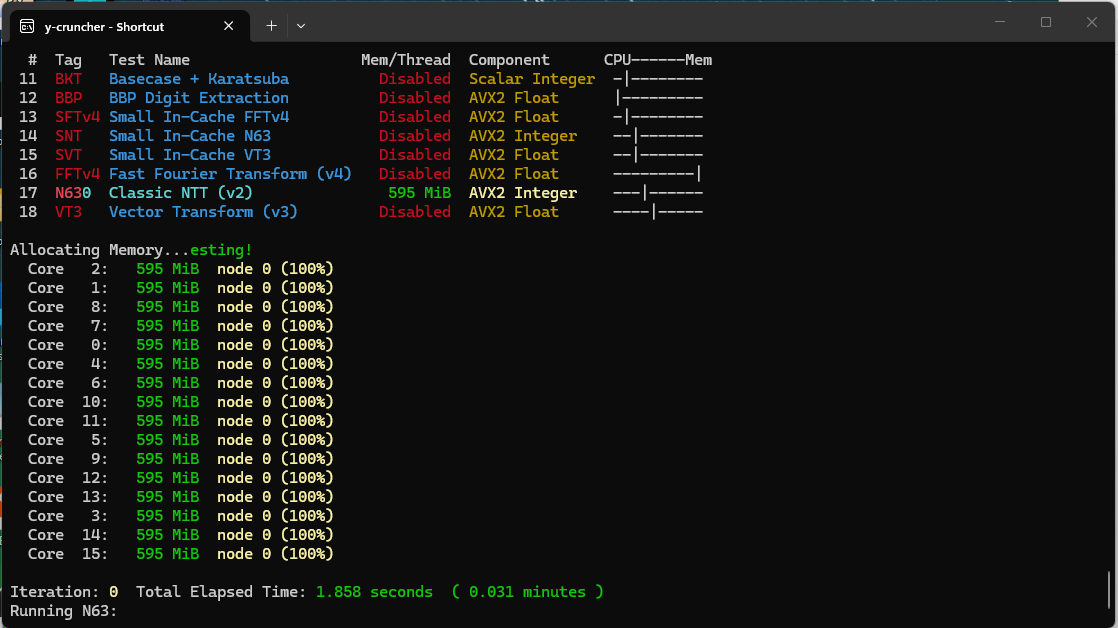
However, the flip side is that it is too sensitive for most people. It is possible that your system was working fine for gaming for the last two years, and it still fails the N63. So, if it is just a gaming PC and nothing else in your life ever fails, it is probably acceptable for you. However, if you also render and code on the same computer, it is definitely not acceptable.
What to look for?
During a y-cruncher test, temperature will tell you nothing. It runs at a much lower package power than Prime 95 Small FFT. So, just keep an eye on CPU package power and core temperature, and you will conclude everything is fine until there is an error.
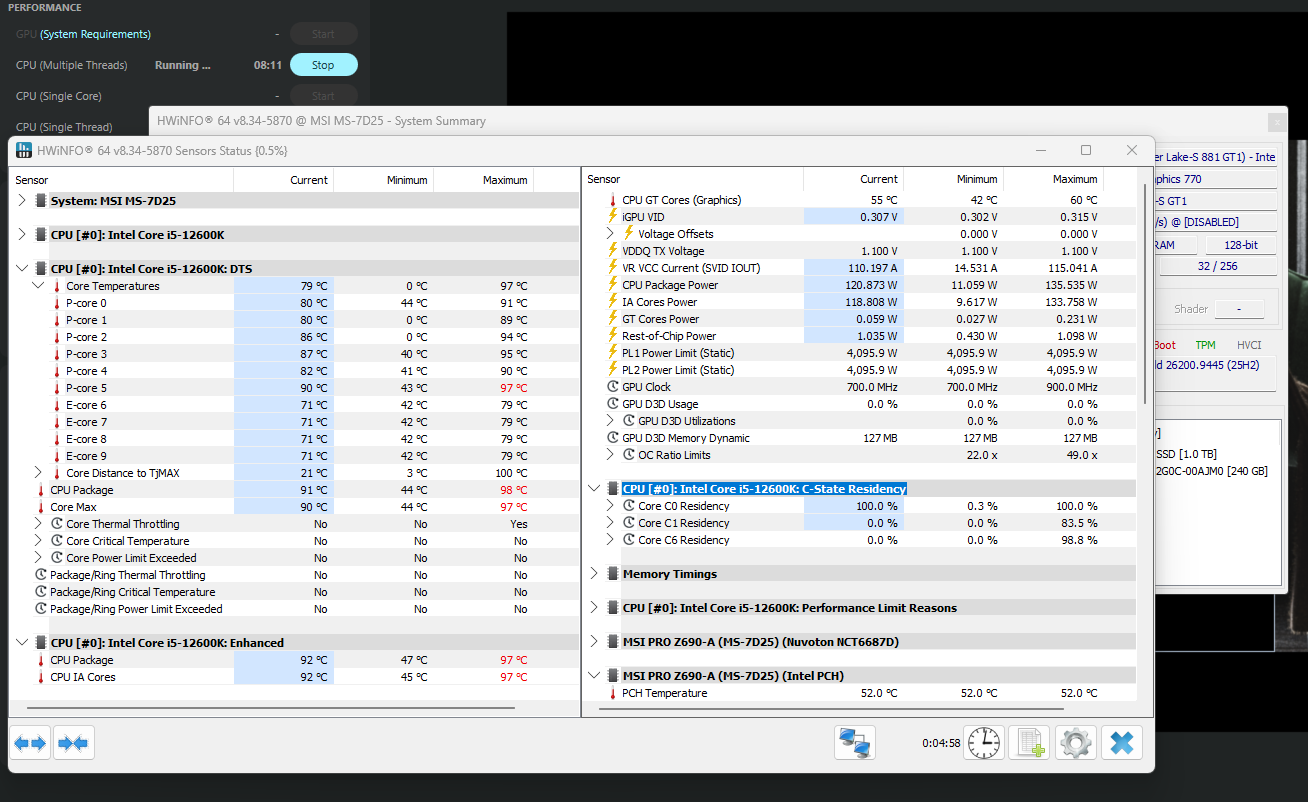
I would recommend keeping track on the memory side as well. VDDCR_SOC on AMD or System Agent / VCCSA on Intel, then FCLK / UCLK / MCLK, DRAM voltage, and Memory Clock. N63 and VT3 lean hard on the memory controller and the cache so make sure you are not having any misbehavious in the memory side.
4. CoreCycler (Per-core undervolt stability)
This is the tool for undervolting. It is basically a PowerShell script. So, you get no fancy visuals. However, using it is pretty easy. Make sure you have the updated .NET version on your computer. In order to run it from the downloaded files, you just fire up the .bat file.
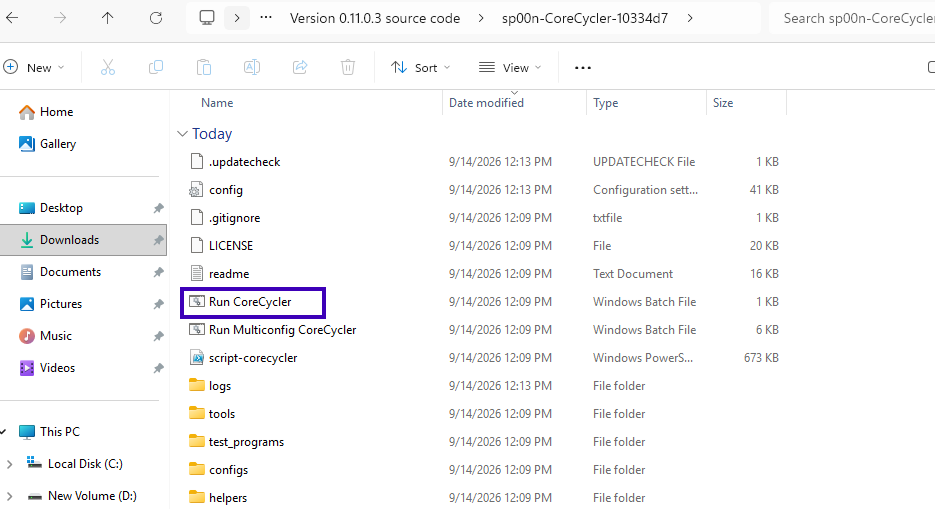
Other than that, you just have to enter y (for yes) in the command prompt.
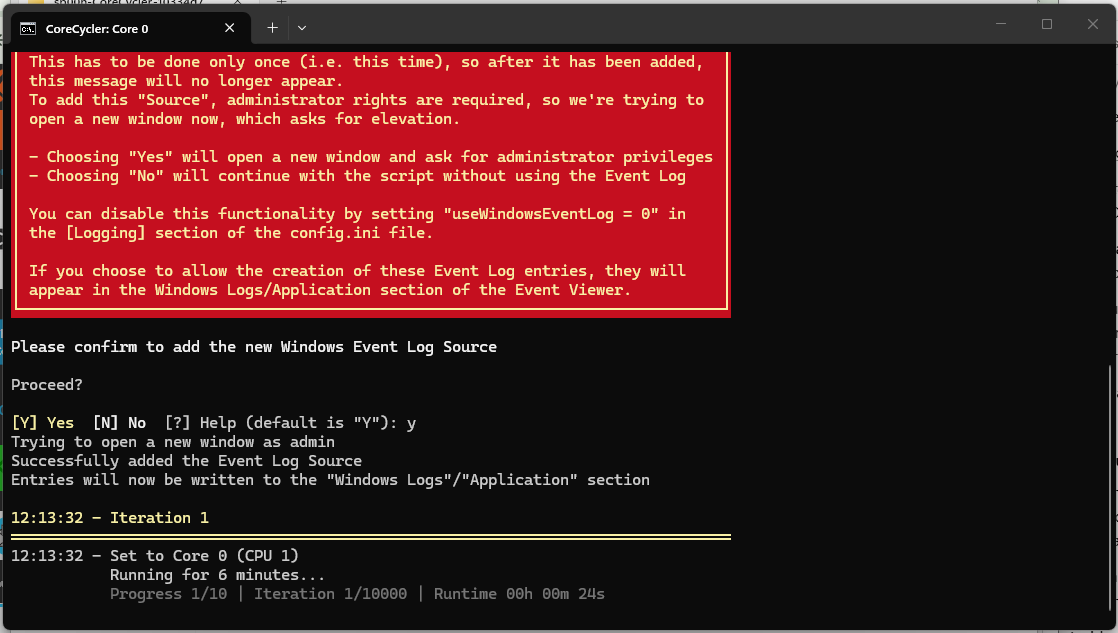
With this software, each physical core is tested individually, at its full single-core boost clock, at its own point on the voltage curve.
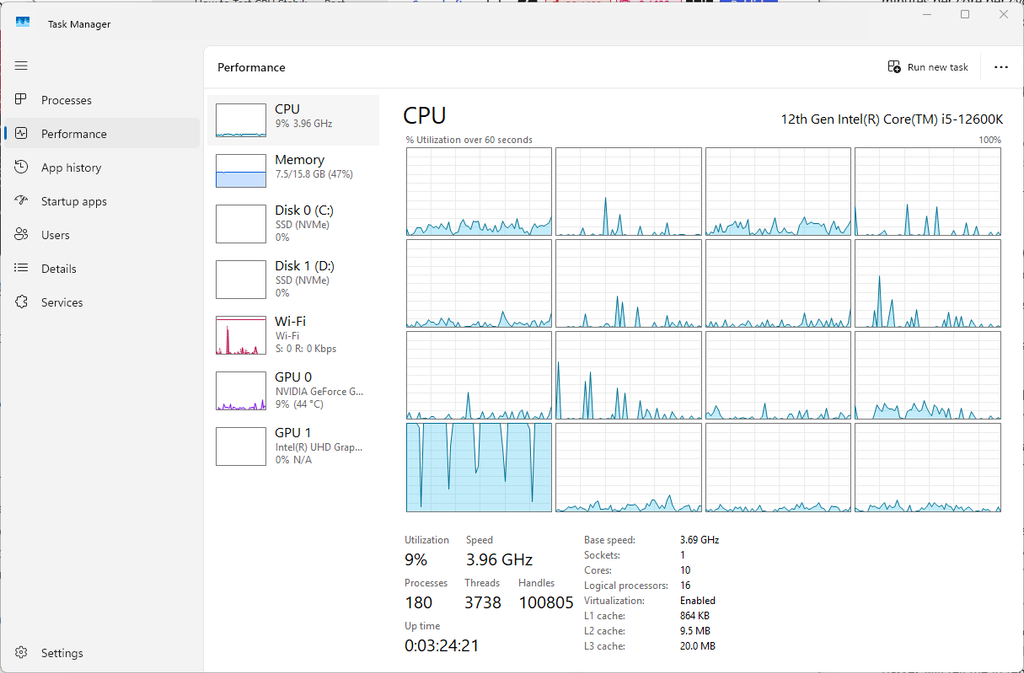
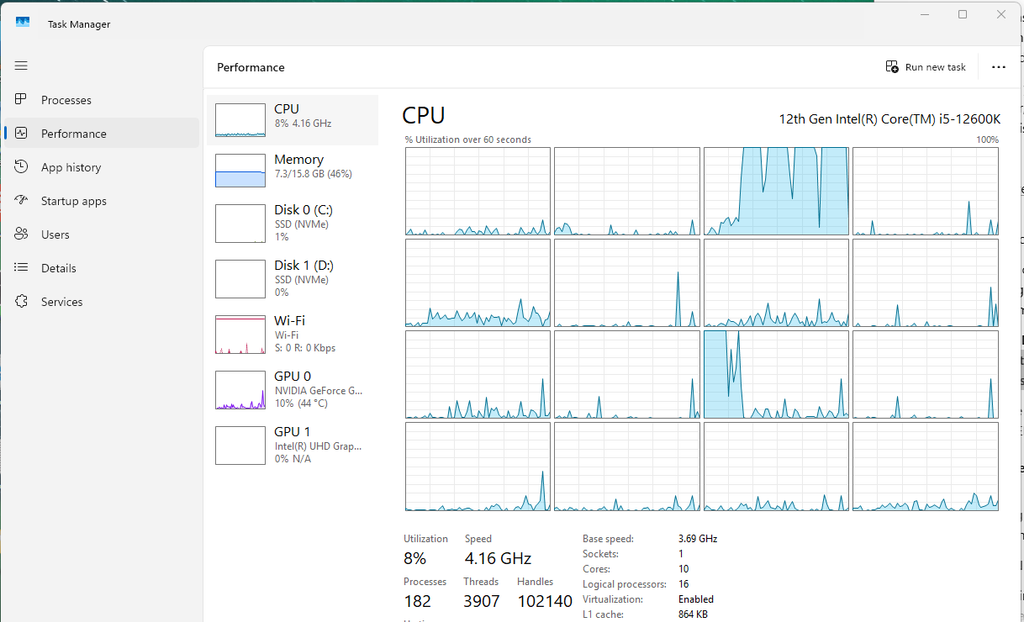
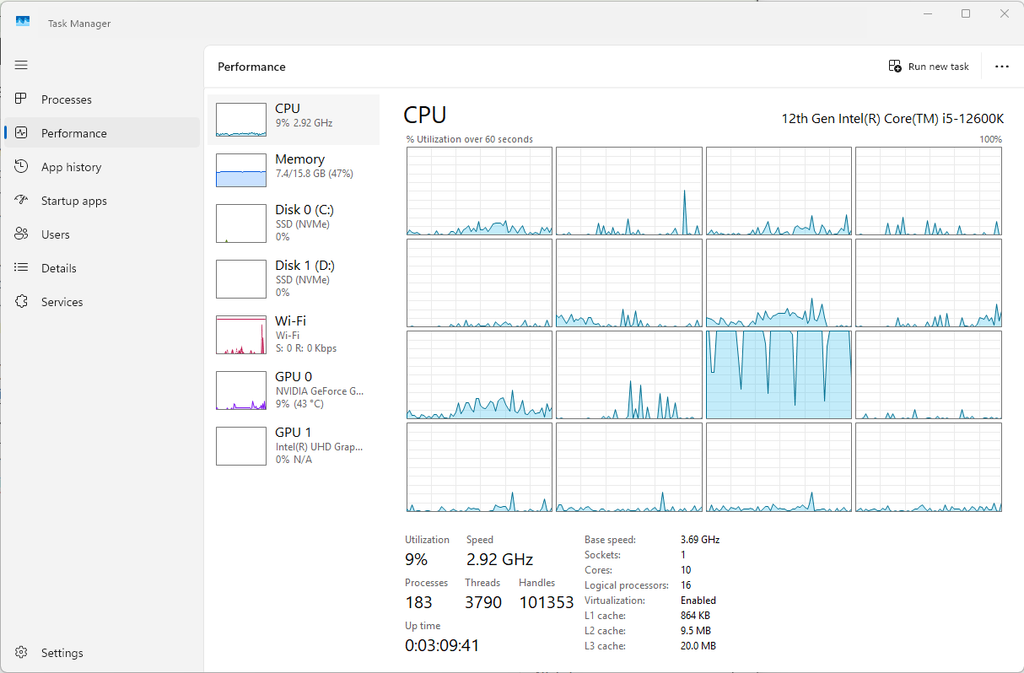
It matters because an all-core test cannot find per-core instability. When we run an all-core load, each core runs at a lower clock and a different voltage than it would alone. For example, a core that is perfectly happy at 5.0 GHz all-core can crash the moment it boosts alone to 5.7 GHz with a -30 Curve Optimizer offset.
Every core in your CPU is physically different. That is what binning is about. So each core needs its own offset, and each core needs its own test. The biggest thing here is the time. If you want the equivalent of a 12-hour Prime95 validation on a 12-core chip, you need 12 × 12 = 144 hours. That is nearly impossible for most of us.
Recent versions (0.11.x) added support for Ryzen 9000 in Automatic Test Mode and replaced the old WinRing0 driver with a PawnIO-based one, so you will need to install PawnIO for the automatic mode to work.
I would suggest running CoreCycler every time you undervolt any CPU, whether Intel or AMD. If you are not doing it, you are not testing your CPU.
What to look for?
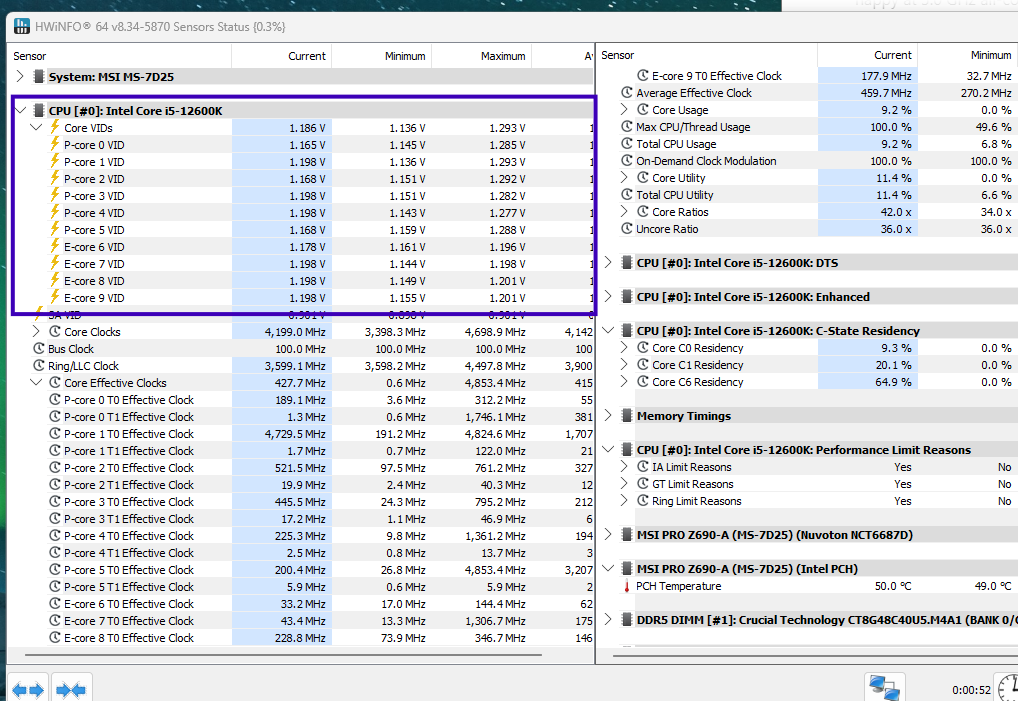
Windows Task Manager will show you the per-core view when you switch to the logical processors in the performance tab. However, in HWiNFO, it is important to confirm the effective color. Check if it is reaching the core’s real single-core boost ceiling. If the active core is sitting at 4.9 GHz when it should be at 5.6 GHz, something is holding boost down, and the test is proving nothing.
Watch Core VID as well. Under a single-threaded load it should be high, often 1.4 V or more on Ryzen. That high-voltage, low-current corner is exactly where Curve Optimizer offsets break, and it is a corner an all-core test never visits.
5. Linpack Xtreme (extreme computational stability and accuracy)
Linpack Xtreme solves systems of dense linear equations and checks the calculations for accuracy. What makes it different is that it can produce very high power consumption and temperatures in a short period. Linear equations are considered the most arithmetic-intensive thing you can ask a CPU to do. It checks the residual of every solution, so it catches errors rather than just crashes. It is also brutally hot.
Intel’s own LINPACK binary is what sits underneath this and underneath IntelBurnTest.
LINPACK is best if you want to find instability faster than almost anything else. In fact, I have to choose a program to tell a quick yes/no on whether an overclock was successful or failed; a few Linpack passes would do it for me. As compared to the Prime95, which is great for sustained, highly demanding CPU stress and finding certain computational instabilities.
Linpack results include a GFlops figure per pass. If the GFlops number drops between passes, you are thermal throttling or clock stretching, even if no error was reported. That is a genuinely useful diagnostic.
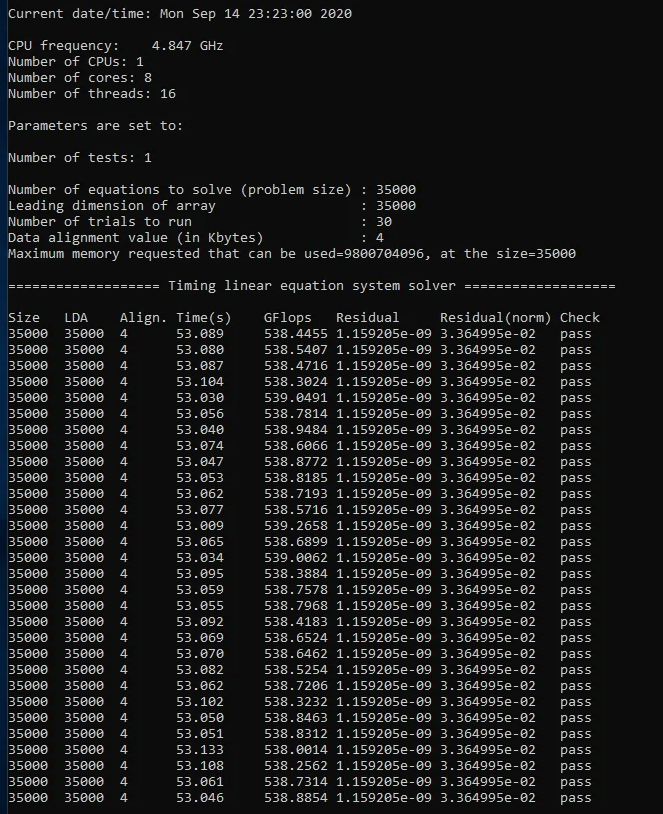
During the test, keep an eye on VRM/VRMOS temperatures, CPU Current (IOUT), and AMD, TDC, and EDC against their limits. Also monitor CPU package power and minimum effective clock. A GFlops drop in Linpack should line up with an effective clock drop in HWiNFO. If the GFlops fell and the effective clock didn’t, look at your memory rather than your cooling.
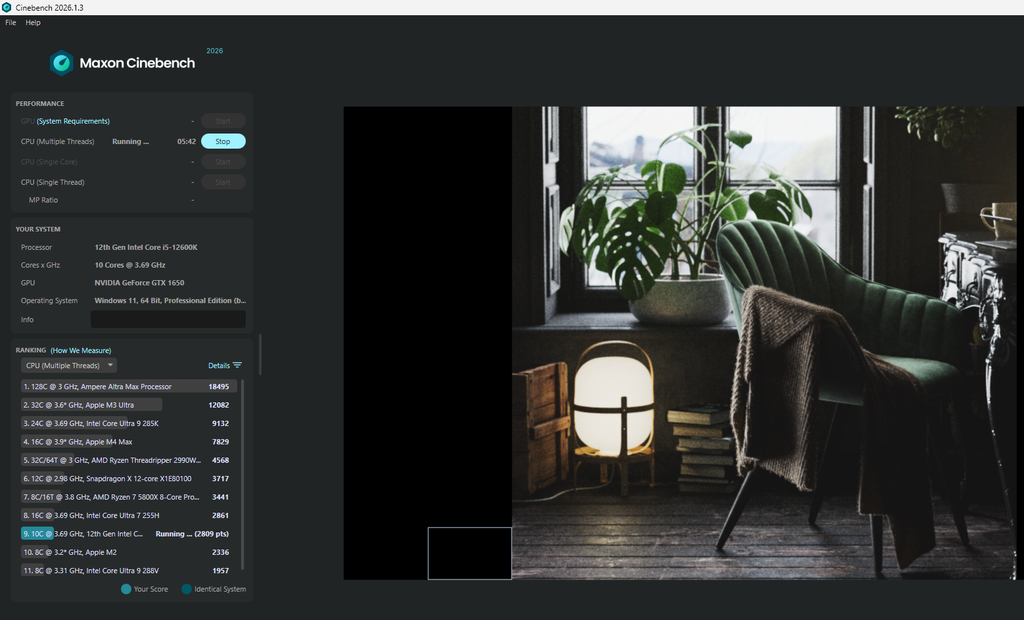
6. Cinebench R23 and Cinebench 2026 (Quick Sanity Check)
When you run a Cinebench benchmark, it renders a scene using the Cinema 4D’s engine. It is a real workload, not a synthetic one. This is its strength and weakness at the same time.
R23 has a minimum test duration option: set it to 10 minutes or 30 minutes, and it will loop. Cinebench 2024 has a similar option.
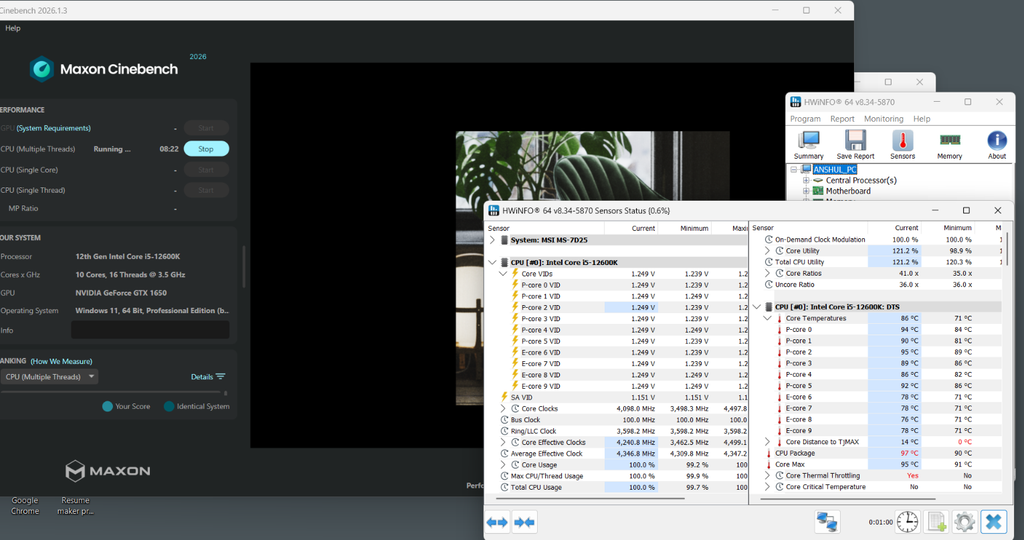
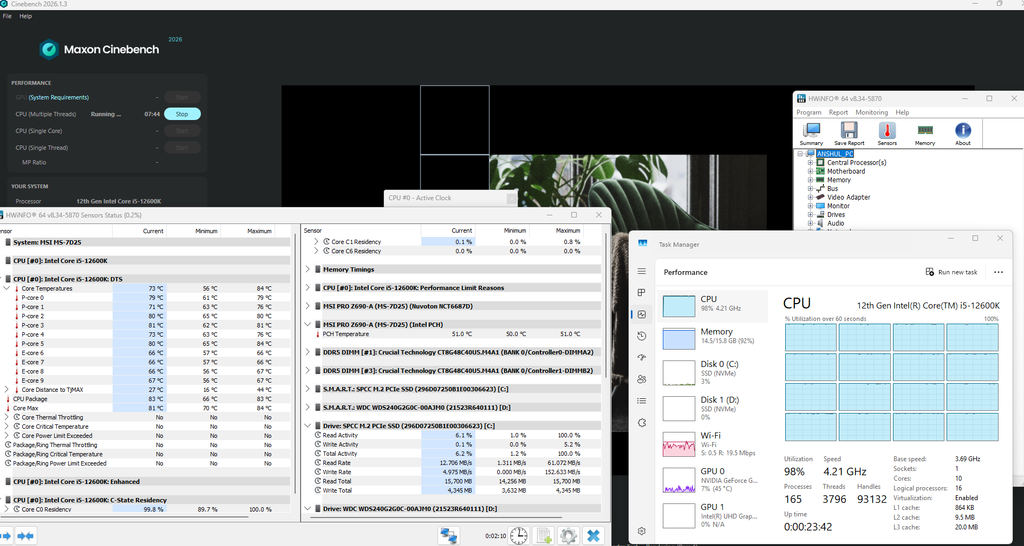
Cinebench is a great sanity check but a terrible stability check. It means that it can find out whether your overclock is completely broken. It works well as a performance checker as well. A 10-minute R23 loop that passes tells you it is worth spending three hours on real testing. But it does not error-check. It just renders, and even if a pixel comes out wrong, you will have no idea.
I would also recommend running Single Core Cinebench separately. It loads one core at maximum boost, which is the undervolt failure condition.
What to look for?
For a multi-core Cinebench or R23 run, I would focus mainly on whether the all-core effective clock holds for the full ten minutes or quietly decays. For the single-core run, find which core Windows put the load on and watch that core’s Effective Clock and Core VID. Because Cinebench checks for no errors, checking WHEA errors in HWiNFO is great.
7. Games and shader compilation (real-world gaming stability)
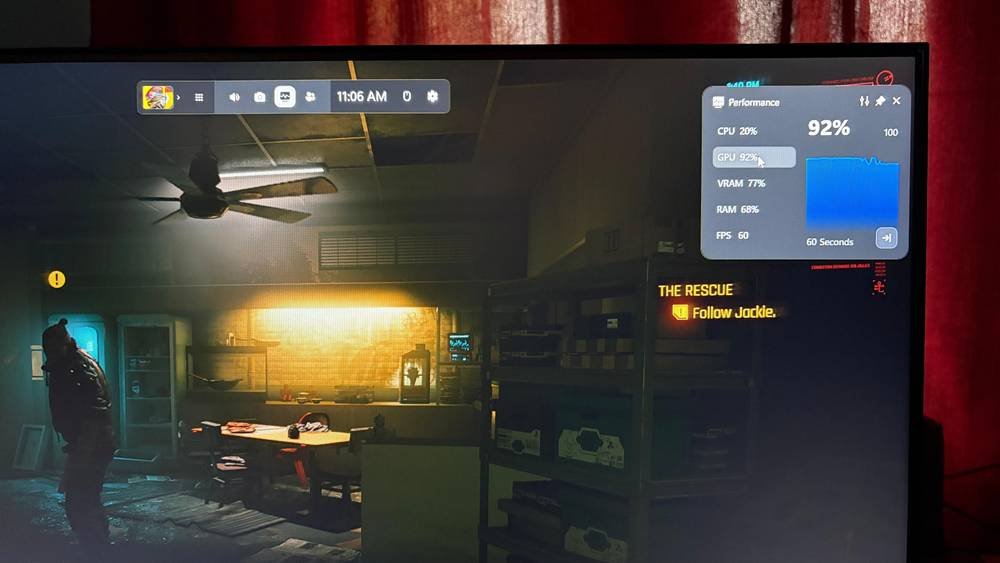
If you are overclocking a gaming system, do not skip this. Games put an unusual load on your system. They combine light and heavy threads and switch between boost states. Shader compilation in particular is a heavy all-core burst. It can easily expose an unstable system more than any synthetic test in the last few years.
So, I would recommend playing games for a few hours. Maybe load a new Unreal Engine title and let it compile shaders.

What to look for?
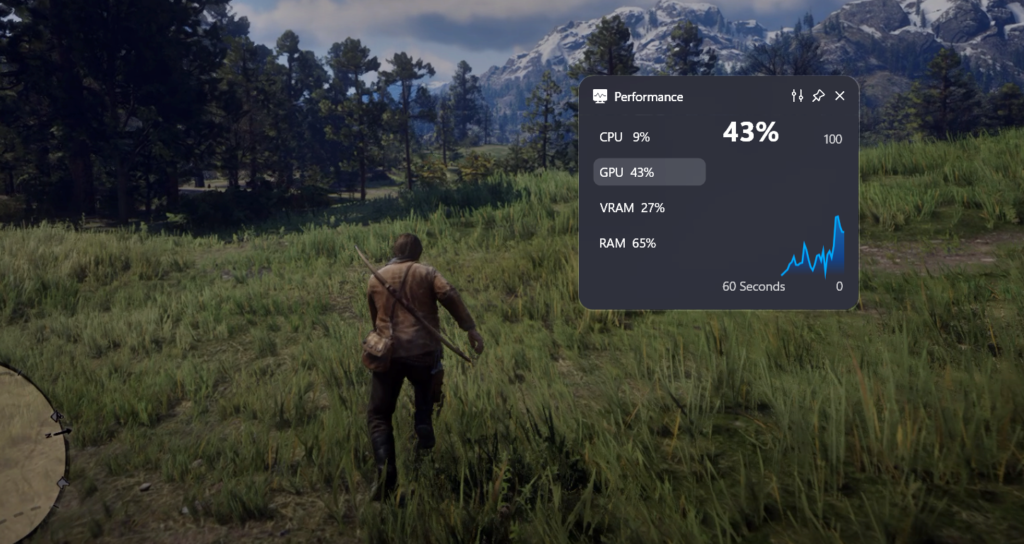
You do not have to keep checking HWiNFO sensor data. You just play games at the best settings possible. Maybe try to keep your GPU above 90%.
Afterwards, look for the minimum effective clock, any WHEA errors logged, and whether thermal throttling ever flipped to yes. Games crash without a blue screen far more often than synthetic tests do, so that log is frequently the only evidence you get.
If you can, also check shader compilation. It is a short, violent all-core burst, and it produces CPU package power spikes that a steady stress test never reaches.
8. Memory Tests (Optional)
CPU stability and memory stability can overlap at various places. It is mainly because the memory controller is situated on the CPU. Especially if you have touched EXPO, XMP, Infinity fabric, or SOC/VCCSA voltage, you should run memory tests too. You can use these programs.
- Karhu RAM Test — paid, excellent, reports coverage percentage. 10,000% coverage is a common target. Very good at finding errors quickly.
- MemTest86 — boots from USB, tests outside Windows. The most thorough, and the only one that removes Windows from the equation.
- OCCT Memory test — convenient because it is already installed.
- Prime95 Large FFT / Blend — tests memory as part of a CPU load.
Recommended routine for testing an overclocking
Here is a system that I generally follow for an overclock. I start with the cheaper and easier things compared to the one after it. Each section will filter out failures before you waste your time on longer tests.
Stage 1: Does the system boot and survive five minutes? I would start with Cinebench R23 multi-core for just a single run. Or I would do an OCCT CPU test, Extreme, AVX2 for five minutes max. If the system fails here, I know my settings are too aggressive, and I will go back to the BIOS and maybe reduce things one step.
Stage 2: The fast filter. Generally a Linpack Xtreme for 10 to 20 passes. Or OCCT for 15 minutes. Watch the GFlops and effective clocks.
Stage 3: Heavy all-core soak. Prime95 Small FFT is most suitable here with AVX2 enabled and AVX-512 disabled. This one will run for at least 2 hours. This is where you confirm your cooling and your voltage under sustained load.
Stage 4: The sensitive test: y-cruncher Component Stress Tester, all algorithms or at least N63 and VT3, for an hour or more. This is where good-looking overclocks fall apart.
Stage 5: Light load and single core. The Cinebench single-core loop is the most suitable here. After that, I would run the system on normal tasks like browsing for an hour or so.
Stage 6: Real work. I would play some games, run code, do some compilations, or maybe compress some heavy files. Now, this can go on for days, and this is where I would start feeling confident about my overclock.
Stage 7: Check the logs. Event Viewer every time, even when nothing crashed.
Recommended routine for testing an undervolt
For undervolting, the steps look different. I follow a routine like this:
Stage 1: Confirm the undervolt is applied. Use HWiNFO for this. Check that the VID and core voltage actually dropped under load. A curve optimizer offset can silently fail to apply, and you may never notice it. So, the first step is confirmation.
Stage 2: Per-core testing. This is the main event. Run CoreCycler with y-cruncher or Prime95 as the engine. Start with 5 minutes per core and let it cycle overnight. Read the log. Any core that throws an error gets a weaker offset, say from -30 to -25.
Repeat. This is iterative, and it can take days. There is no shortcut in this.
Stage 3: Single-core boost load. Cinebench single-core in a loop. I would maybe run y-cruncher with one thread.
Stage 4: Variable load. The best and easiest option is the OCCT CPU test in variable mode with AVX2 for around one hour. The constant load transitions are what you are after here.
Stage 5: Idle and light load. Set your Windows power plan to Balanced, not High Performance. You want the CPU to actually enter deep C-states and come back out.
Then leave the machine on and barely used for a few hours. Browse the web. Watch a video. Let it sleep and wake it up.
Stage 6: All-core, for completeness. Prime95 or OCCT for an hour. On an undervolt, this is the easiest test, not the hardest, so it goes last.
Stage 7: Event Viewer. On Ryzen, watch specifically for WHEA Event ID 18 or 19 with a Cache Hierarchy Error. That is the classic sign of a curve optimizer offset that is one or two steps too negative.
Reading a Failure
If you are going for an agressive overclock and trying to take the CPU at its highest limits, you will face many errors on the way. So, you should know how to read them and what they actually mean. You can always search internet for it but let me give you some common stop codes and what they generally mean.
| Stop code | Name | Usually means |
|---|---|---|
| 0x124 | WHEA_UNCORRECTABLE_ERROR | Core voltage too low for the clock, or SoC/VCCSA wrong. The most common OC BSOD. |
| 0x101 | CLOCK_WATCHDOG_TIMEOUT | A core stopped responding. Almost always not enough vcore. |
| 0x133 | DPC_WATCHDOG_VIOLATION | Often a cache/ring or a driver. Check cache voltage. |
| 0x1E | KMODE_EXCEPTION_NOT_HANDLED | Frequently memory or cache related. |
| 0x3B | SYSTEM_SERVICE_EXCEPTION | Vcore or cache voltage. |
| 0x50 | PAGE_FAULT_IN_NONPAGED_AREA | Memory. Test RAM. |
| 0x0A | IRQL_NOT_LESS_OR_EQUAL | Memory or memory controller. |
| 0xD1 | DRIVER_IRQL_NOT_LESS_OR_EQUAL | Usually memory, sometimes a driver. |
| 0x9C / 0x9F | MACHINE_CHECK_EXCEPTION | Hardware-level error. Check voltages and temperatures. |
| Freeze, no BSOD | — | Often a severe undervolt or a power delivery problem. |
| Instant reboot, no BSOD | — | Power delivery, PSU, or a very unstable undervolt. |
| App crashes only | — | Cache, ring bus, Infinity Fabric, or memory. |
Use Event Viewer Properly
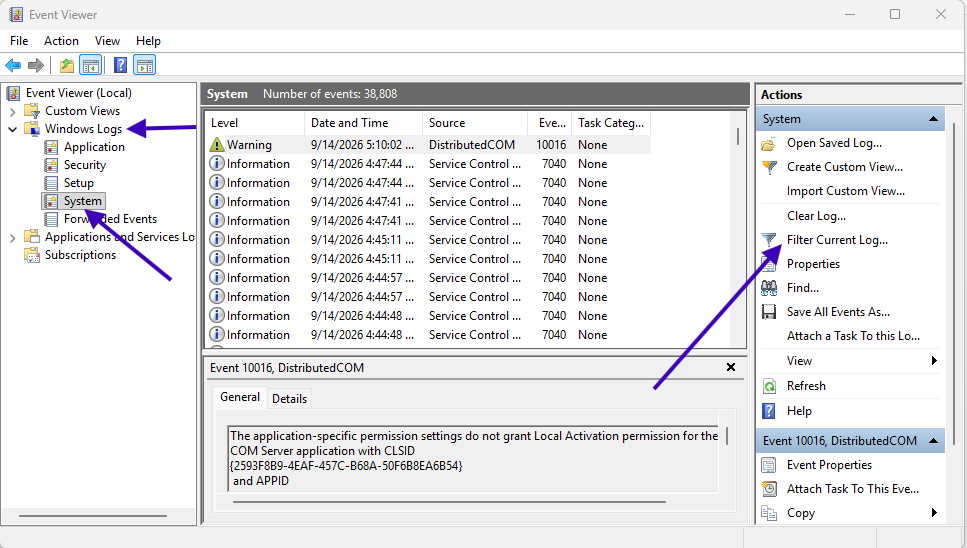
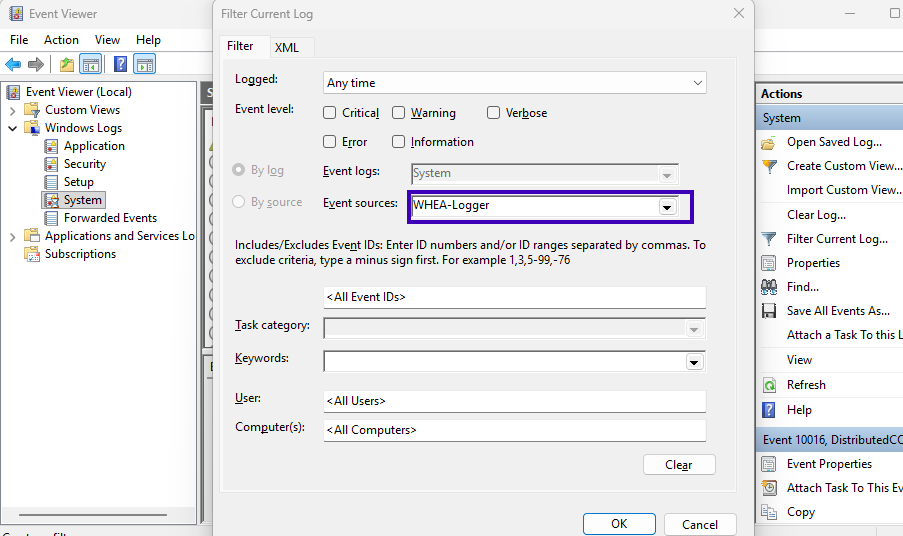
Open Event Viewer, then go to Windows Logs > System. Use Filter Current Log and filter by source WHEA-Logger.
- Event ID 17: corrected hardware error
- Event ID 18: fatal hardware error
- Event ID 19: corrected machine check
- Event ID 47: corrected machine check, often cache
But keep in mind that a corrected error still counts as instability. It is possible that Windows caught it and moves on. In that case, you see nothing in the Event Viewer. But, HWiNFO shows a running WHEA error count in its sensor list too, which is the easy way to spot this without opening Event Viewer every hour.
Temperature: What are the limits?
Intel chips will throttle around 100°C and shut down around 105°C. A 100°C sustained temperature during a synthetic test means the test is fine, but your cooling is the limit. However, sustained 100°C when you are just gaming translate to a problem.
AMD Ryzen CPUs will happily sit at 95°C by design under PBO. For processors in the 7000 and 9000 series, this temperature is normal. However, on X3D chips it is better to stay lower than that.
You should immediately stop testing if you see the temperature climbing past the throttle point.
Also, keep in mind that a throttled test is a wasted test in all cases. If the CPU has to downclock just to survive, you are no longer testing the settings you configured. I have covered safe temperatures and cooling in detail in the CPU overheating article, so I will not repeat it here.
Mistakes to avoid
I have seen people running Prime95 for 30 minutes and call the overclock stable, which proves their cooler works and nothing else. Also passing Cinebench, Prime95, or Linpack does not prove universal stability. Different workloads stress different parts of the CPU. A good validation is when you understand your tweaks and then do the tests accordingly.
Because nothing crashed doesn’t necessarily mean nothing went wrong. A corrected WHEA error means the CPU already produced a wrong result, and the hardware quietly fixed it for you. Keep the WHEA errors counter visible in HWiNFO and use Event viewer as we discussed above.
If you have done an undervolt, focus more on per-core tests like CoreCycler per core, single-core Cinebench, and OCCT in Variable mode. As we discussed earlier, heavy all-core loads can easily be survived by an undervolt, which might fail in a single-core run.
Use the Balanced plan while validating an undervolt, and let the machine genuinely sit idle, go to sleep, and wake up again. Another thing is never to change two things at once because in case something went wrong, you never know which one did that.
I would advise not to assume stock is stable. A degraded core, a bad memory kit, a low-end VRM, or a tired power supply will crash a system at defaults too. So, the rule is that if you cannot pass stability tests at stock, your problem is not overclocking.
Conclusion
Stability testing is variable for different computers and different types of overclocks. The results you are looking for from an overclock might not be desired by another. So, there is no single test that proves a CPU is stable, and the test you need depends entirely on whether you raised the clock or lowered the voltage.
I have tried to make this article as detailed as possible, and I know there are many things that could be added to it. I would like to hear your thoughts and suggestions in the comments.